
Understanding the Coordinate Plane form is essential for anyone diving into the world of mathematics and geometry. This form serves as a foundational tool for plotting points, understanding relationships between variables, and visualizing data in a two-dimensional space. One of the primary aspects of the Coordinate Plane is its division into four quadrants, each representing different combinations of positive and negative values along the X and Y axes. Familiarizing oneself with the horizontal (X-axis) and vertical (Y-axis) lines that intersect at the origin (0, 0) provides a structured way to pinpoint exact locations in this grid-like system. Additionally, the method of writing coordinates in ordered pairs, such as (3, 4) or (-2, -5), allows for precise communication of positions. Through the use of this form, individuals can perform various operations, analyze equations, and even engage in advanced topics such as graphing linear equations and transformations. Exploring the multitude of applications for the Coordinate Plane form can lead to a deeper appreciation of its significance in both mathematics and everyday problem-solving.
|
|
|
|
|
|
|
|
|
|
|
Y |
|
|
|
|
|
|
|
|
|
|
|
|
|
|
|
|
|
|
|
|
|
|
|
|
|
|
|
|
|
|
|
|
|
|
|
|
|
|
|
|
|
|
|
|
|
|
|
|
|
|
|
|
|
|
|
|
|
|
|
|
|
|
|
|
|
|
|
|
|
|
|
17 |
|
|
|
|
|
|
|
|
|
|
|
|
|
|
|
|
|
|
|
|
|
|
|
|
|
|
|
|
|
|
|
|
|
|
|
|
|
|
|
|
|
|
|
|
|
|
|
16 |
|
|
|
|
|
|
|
|
|
|
|
|
|
|
|
|
|
|
|
|
|
|
|
|
|
|
|
|
|
|
|
|
|
|
|
|
|
|
|
|
|
|
|
|
|
|
|
15 |
|
|
|
|
|
|
|
|
|
|
|
|
|
|
|
|
|
|
|
|
|
|
|
|
|
|
|
|
|
|
|
|
|
|
|
|
|
|
|
|
|
|
|
|
|
|
|
14 |
|
|
|
|
|
|
|
|
|
|
|
|
|
|
|
|
|
|
|
|
|
|
|
|
|
|
|
|
|
|
|
|
|
|
|
|
|
|
|
|
|
|
|
|
|
|
|
13 |
|
|
|
|
|
|
|
|
|
|
|
|
|
|
|
|
|
|
|
|
|
|
|
|
|
|
|
|
|
|
|
|
|
|
|
|
|
|
|
|
|
|
|
|
|
|
|
12 |
|
|
|
|
|
|
|
|
|
|
|
|
|
|
|
|
|
|
|
|
|
|
|
|
|
|
|
|
|
|
|
|
|
|
|
|
|
|
|
|
|
|
|
|
|
|
|
11 |
|
|
|
|
|
|
|
|
|
|
|
|
|
|
|
|
|
|
|
|
|
|
|
|
|
|
|
|
|
|
|
|
|
|
|
|
|
|
|
|
|
|
|
|
|
|
|
10 |
|
|
|
|
|
|
|
|
|
|
|
|
|
|
|
|
|
|
|
|
|
|
|
|
|
|
|
|
|
|
|
|
|
|
|
|
|
|
|
|
|
|
|
|
|
|
|
9 |
|
|
|
|
|
|
|
|
|
|
|
|
|
|
|
|
|
|
|
|
|
|
|
|
|
|
|
|
|
|
|
|
|
|
|
|
|
|
|
|
|
|
|
|
|
|
|
8 |
|
|
|
|
|
|
|
|
|
|
|
|
|
|
|
|
|
|
|
|
|
|
|
|
|
|
|
|
|
|
|
|
|
|
|
|
|
|
|
|
|
|
|
|
|
|
|
7 |
|
|
|
|
|
|
|
|
|
|
|
|
|
|
|
|
|
|
|
|
|
|
|
|
|
|
|
|
|
|
|
|
|
|
|
|
|
|
|
|
|
|
|
|
|
|
|
6 |
|
|
|
|
|
|
|
|
|
|
|
|
|
|
|
|
|
|
|
|
|
|
|
|
|
|
|
|
|
|
|
|
|
|
|
|
|
|
|
|
|
|
|
|
|
|
|
5 |
|
|
|
|
|
|
|
|
|
|
|
|
|
|
|
|
|
|
|
|
|
|
|
|
|
|
|
|
|
|
|
|
|
|
|
|
|
|
|
|
|
|
|
|
|
|
|
4 |
|
|
|
|
|
|
|
|
|
|
|
|
|
|
|
|
|
|
|
|
|
|
|
|
|
|
|
|
|
|
|
|
|
|
|
|
|
|
|
|
|
|
|
|
|
|
|
3 |
|
|
|
|
|
|
|
|
|
|
|
|
|
|
|
|
|
|
|
|
|
|
|
|
|
|
|
|
|
|
|
|
|
|
|
|
|
|
|
|
|
|
|
|
|
|
|
2 |
|
|
|
|
|
|
|
|
|
|
|
|
|
|
|
|
|
|
|
|
|
|
|
|
|
|
|
|
|
|
|
|
|
|
|
|
|
|
|
|
|
|
|
|
|
|
|
1 |
|
|
|
|
|
|
|
|
|
|
|
|
|
|
|
|
|
|
|
|
|
|
|
|
|
|
|
|
|
|
|
|
|
|
|
|
0 |
1 |
2 |
3 |
4 |
5 |
6 |
7 |
8 |
9 |
10 |
11 |
12 |
|||||||||||
|
|
|
|
|
|
|
|
|
|
|
|
|
|
|
|
|
|
|
|
|
|
|
|
|
|
|
|
|
|
|
|
|
|
|
|
|
|
|
|
|
|
|
|
|
|
|
|
|
|
|
|
|
|
|
|
|
|
|
|
|
|
|
|
|
|
|
|
|
|
|
|
|
|
|
|
|
|
|
|
|
|
|
|
|
|
|
|
|
|
|
|
|
|
|
|
|
|
|
|
|
|
|
|
|
|
|
|
|
|
|
|
|
|
|
|
|
|
|
|
|
|
|
|
|
|
|
|
|
|
|
|
|
|
|
|
|
|
|
|
|
|
|
|
|
|
|
|
|
|
|
|
|
|
|
|
|
|
|
|
|
|
|
|
|
|
|
|
|
|
|
|
|
|
|
|
|
|
|
|
|
|
|
|
|
|
|
|
|
|
|
|
|
|
|
|
|
|
|
|
|
|
|
|
|
|
|
|
|
|
|
|
|
|
|
|
|
|
|
|
|
|
|
|
|
|
|
|
|
|
|
|
|
|
|
|
|
|
|
|
|
|
|
|
|
|
|
|
|
|
|
|
|
|
|
|
|
|
|
|
|
|
|
|
|
|
|
|
|
|
|
|
|
|
|
|
|
|
|
|
|
|
|
|
|
|
|
|
|
|
|
|
|
|
|
|
|
|
|
|
|
|
|
|
|
|
|
|
|
|
|
|
|
|
|
|
|
|
|
|
|
|
|
|
|
|
|
|
|
|
|
|
|
|
|
|
|
|
|
|
|
|
|
|
|
|
|
|
|
|
|
|
|
|
|
|
|
|
|
|
|
|
|
|
|
|
|
|
|
|
|
|
|
|
|
|
|
|
|
|
|
|
|
|
|
|
|
|
|
|
|
|
|
|
|
|
|
|
|
|
|
|
|
|
|
|
|
|
|
|
|
|
|
|
|
|
|
|
|
|
|
|
|
|
|
|
|
|
|
|
|
|
|
|
|
|
|
|
|
|
|
|
|
|
|
|
|
|
|
|
|
|
|
|
|
|
|
|
|
|
|
|
|
|
|
|
|
|
|
|
|
|
|
|
|
|
|
|
|
|
|
|
|
|
|
|
|
|
|
|
|
|
|
|
|
|
|
|
|
|
|
|
|
|
|
|
|
|
|
|
|
|
|
|
|
|
|
|
|
|
|
|
|
|
|
|
|
|
|
|
|
|
|
|
|
|
|
|
|
|
|
|
|
|
|
|
|
|
|
|
|
|
|
|
|
|
|
|
|
|
|
|
|
|
|
|
|
|
|
|
|
|
|
|
|
|
|
|
|
|
|
|
|
|
|
|
|
|
|
|
|
|
|
|
|
|
|
|
|
|
|
|
|
|
|
|
|
|
|
|
|
|
|
|
|
|
|
|
|
|
|
|
|
|
|
|
|
|
|
|
|
|
|
|
|
|
|
|
|
|
|
|
|
|
|
|
|
|
|
|
|
|
|
|
|
|
|
|
|
|
|
|
|
|
|
|
|
|
|
|
|
|
|
|
|
|
|
|
|
|
|
|
|
|
|
|
|
|
|
|
|
|
|
|
|
|
|
|
|
|
|
|
|
|
|
|
|
|
|
|
|
|
|
|
|
|
|
|
|
|
|
|
|
|
|
|
|
|
|
|
|
|
|
|
|
|
|
|
|
|
|
|
|
|
|
|
|
|
|
|
|
|
|
|
|
|
|
|
|
|
|
|
|
|
|
|
|
|
|
|
|
|
|
|
|
|
|
|
|
|
|
|
|
|
|
|
|
|
|
|
|
|
|
|
|
|
|
|
|
|
|
|
|
|
|
|
|
|
|
|
|
|
|
|
|
|
X
TheMathWorksheetSite.com
| Fact Name | Description |
|---|---|
| Definition | The coordinate plane form represents points in a two-dimensional space using an x-coordinate and a y-coordinate. |
| Quadrants | The coordinate plane is divided into four quadrants, each indicating different combinations of positive and negative values. |
| Origin | The center point of the coordinate plane is known as the origin, located at the intersection of the x-axis and y-axis (0,0). |
| Graphing Lines | Linear equations can be graphed in the coordinate plane, allowing for visual representation of relationships between variables. |
| Distance Formula | To find the distance between two points in the plane, the distance formula is used: √((x2 - x1)² + (y2 - y1)²). |
| Slope Formula | The slope of a line between two points can be calculated using the formula: (y2 - y1) / (x2 - x1). |
| Applications | Coordinate plane forms are used in mathematics, physics, engineering, and various real-world applications such as mapping and navigation. |
Completing the Coordinate Plane form is essential for organizing your data effectively. After filling out this form, you will have a clear picture of how your data points relate to each other on a graph. This organization will assist in analyzing trends or patterns that may be present in your data.
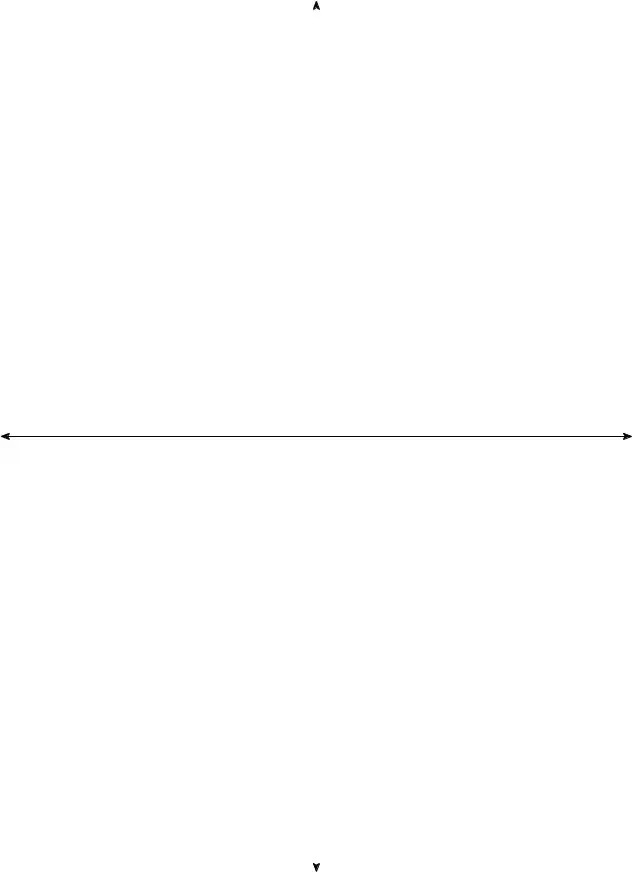
What is the Coordinate Plane?
The Coordinate Plane, also known as the Cartesian Plane, consists of two perpendicular lines: the x-axis (horizontal) and the y-axis (vertical). Each point on this plane is defined by an ordered pair of numbers (x, y), which represent the distance from the origin (0,0) along each axis.
How do I plot a point on the Coordinate Plane?
To plot a point, start at the origin. Move horizontally to the right for positive x-values and to the left for negative x-values. Then, move vertically up for positive y-values and down for negative y-values. Mark the point where these two movements intersect.
What do the quadrants represent?
The Coordinate Plane is divided into four quadrants. Quadrant I is where both x and y are positive. Quadrant II has a negative x and a positive y. In Quadrant III, both values are negative. Finally, Quadrant IV has a positive x and a negative y. Understanding these quadrants helps identify the location of points.
How do I find the distance between two points?
The distance between two points (x1, y1) and (x2, y2) can be calculated using the distance formula: √((x2 - x1)² + (y2 - y1)²). This mathematical approach gives the direct distance between the two points in the plane.
What is the significance of the origin?
The origin of the Coordinate Plane is the point (0,0), where both the x-axis and y-axis intersect. It serves as the reference point for all other points on the plane. Understanding the position of the origin helps in determining the coordinates of other points.
Can I use negative coordinates?
Yes, negative coordinates are essential for locating points on the Coordinate Plane. Points with negative x-values are found to the left of the origin, while points with negative y-values are found below it. Both positive and negative values allow for a full representation of all areas in the plane.
What are ordered pairs?
Ordered pairs, written as (x, y), represent the coordinates of a point on the Coordinate Plane. The first value, x, indicates the horizontal position, while the second value, y, shows the vertical position. The order of these values is crucial, as swapping them changes the location of the point.
Missing Key Information: Many people neglect to fill in all the required fields. It’s essential to provide all requested details to ensure accurate representation on the coordinate plane.
Incorrect Coordinates: A common mistake involves entering coordinates incorrectly. Double-check that you have the right values for both the x and y positions. Any errors here can lead to misunderstandings about the data.
Confusing the Axes: Some individuals mix up the x-axis and y-axis. Remember, the x-axis runs horizontally, while the y-axis runs vertically. Properly identifying these axes is crucial for accurate plotting.
Neglecting to Review: Skipping the final review step can be detrimental. Taking a moment to review your entries can catch any mistakes before submitting the form, saving time and frustration later.
The Coordinate Plane form is just one of many essential documents used in various fields like education, engineering, and design. Understanding the accompanying forms and documents can help put the coordinate plane into context and enhance its utility in practical applications.
These documents work together to enhance the understanding and application of the Coordinate Plane form. Whether in educational settings, professional environments, or recreational use, each has its role in helping individuals navigate the world that numerical representation offers.
The Coordinate Plane form is often compared to the Graphing Paper form. Both documents serve as visual aids designed to enhance understanding of mathematical concepts. Graphing paper provides a grid where students can plot points and observe relationships among variables. Similarly, the Coordinate Plane form structures these points into a more organized layout, specifically emphasizing the x and y axes. Together, they encourage spatial reasoning and help individuals visualize equations in a clear format.
Another document similar to the Coordinate Plane form is the Cartesian Coordinates form. This document serves the same purpose of defining the position of points in a two-dimensional space but does it in a more theoretical context. The Cartesian Coordinates form outlines how points are represented by pairs of numerical values, which directly correspond to their location on the x and y axes. Both documents rely on the same mathematical principles, illustrating how coordinates represent a point’s location on a plane.
The Function Table is another document that provides a similar function. While it does not visualize points graphically, it organizes pairs of values that represent a function. Just like the Coordinate Plane form organizes points along axes, a Function Table simplifies the representation of input and output values. This allows individuals to discern patterns and relationships between x and y, key to understanding mathematical functions.
The Slope-Intercept form parallels the Coordinate Plane as both deal with linear equations. While the Slope-Intercept form focuses on the relationship defined by the equation y = mx + b, the Coordinate Plane form provides a space to graph these relationships visually. By translating equations into a plotted form, both documents highlight how algebraic expressions translate into graphical representations.
Another document, the Polygon Definition form, can be seen as similar through its use of vertices and coordinates. In geometry, polygons consist of points defined in a plane, just like the Coordinate Plane form marks specific coordinates. Both documents emphasize the relationship between individual points or vertices and the overall shape they create, pointing to a deeper understanding of spatial concepts.
Lastly, the Scatter Plot form shares commonalities with the Coordinate Plane form. Both formats allow for the visualization of data points in a graph, but the Scatter Plot is specifically used to represent correlations between two variables. While the Coordinate Plane emphasizes the axes and the relationship among points in a more abstract manner, the Scatter Plot applies this concept to practical data analysis, showcasing trends and patterns visually.
When filling out the Coordinate Plane form, adherence to specific guidelines is essential for accuracy. Here’s what to do and what to avoid:
The coordinate plane is a fundamental concept in mathematics, yet many people harbor misconceptions about it. Clarifying these misconceptions can enhance understanding and appreciation of this valuable tool.
By addressing these common misconceptions, individuals can develop a richer understanding of the coordinate plane and its applications in various fields such as mathematics, science, and even art.
Here are important points to remember regarding the Coordinate Plane form: